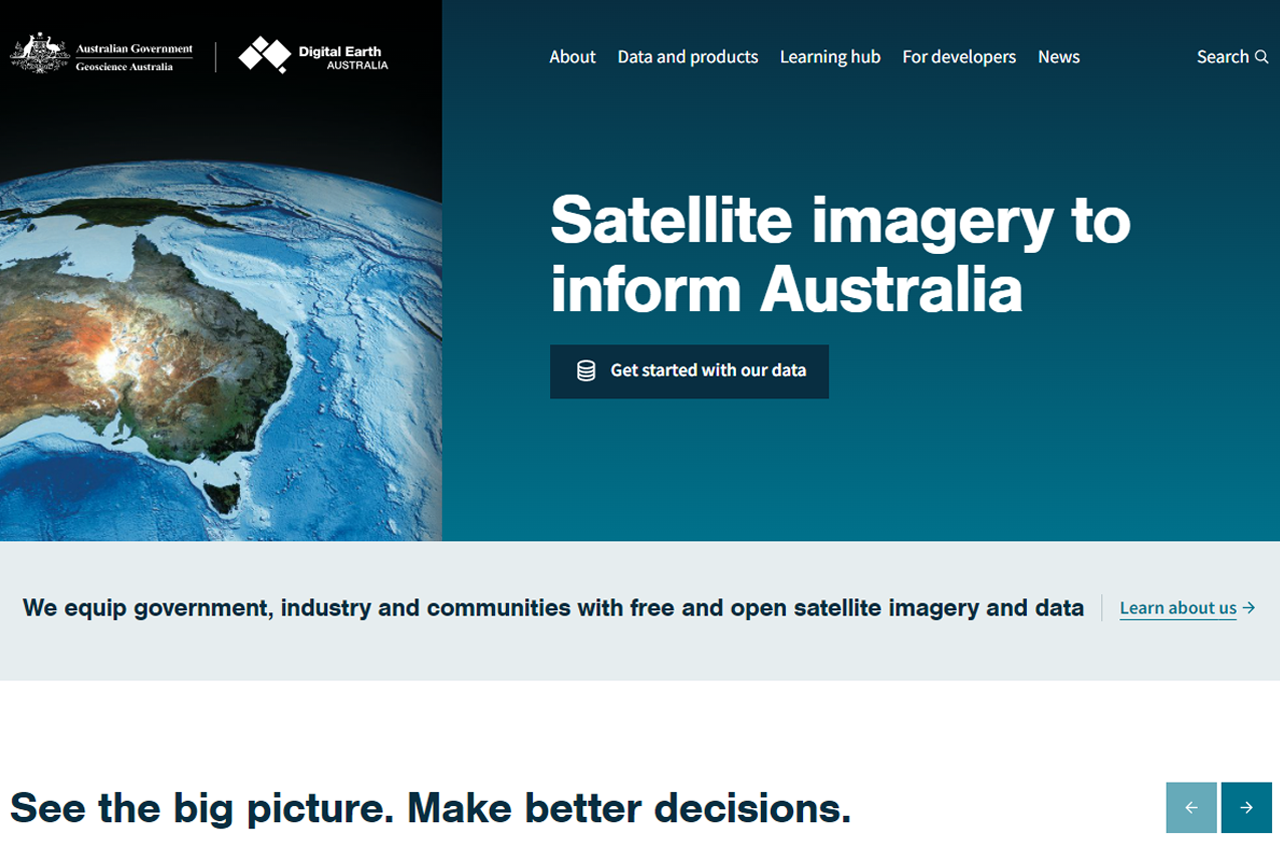
Geoscience recently overhauled its Digital Earth (DEA) platform to provide a more accessible, efficient and consistent user experience.
The new DEA site uses modern to provide free and open satellite data products for governments, industry and the wider community. The satellite data and products from DEA are crucial to inform and guide government policy and to allow industries to make better decisions and innovate new products and services.
Digital Earth Australia is much more than a website — it's a platform that allows users to discover, identify and consume Australian earth data. DEA provides a range of products, tools and services based on satellite data, primarily and satellites.
This Open Data Insights, the first of a two-part series, provides a high-level overview of the Digital Earth Australia platform, the data and tools, including:
- The Open Data Cube, the platform that powers DEA
- Earth observation data, tools and services
- The DEA Sandbox
- The DEA Map
The DEA platform
The Digital Earth Australia platform is powered by Open Data (ODC), an open-source software project (using new computing infrastructures, technologies and data architectures) for managing and analysing geospatial data. At its core, the ODC is a software library and set of command line tools.
The Open Data Cube project, developed and supported by six institutional , aims to better manage the rapidly increasing volume of earth observation data, and enable exploitation and analysis of available satellite data.
ODC is essentially made up of three things:
- The data: earth observation data, stored locally or in the cloud
- An index: a PostgreSQL database listing of data products
- The software: Python libraries to ingest, index and query data (as well as many other functions related to managing data)
DEA data, services and tools
The Digital Earth Australia platform catalogues large amounts of earth observation data — 35 years worth of satellite data from 1986 (or about 9 petabytes of data!). The satellite data are analysis , meaning they are validated, calibrated and adjusted for Australian conditions. This significantly lowers the barrier to use and analyse the data.
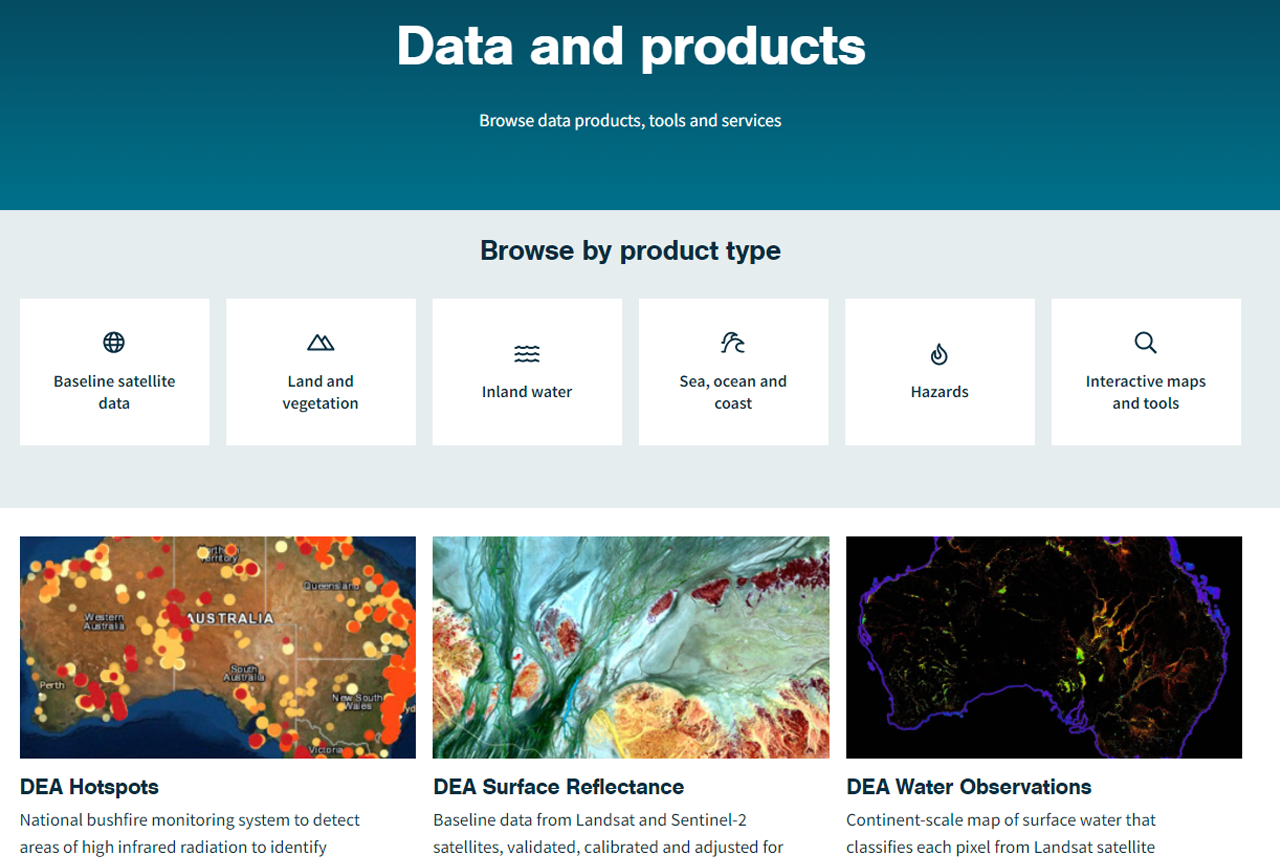
The DEA website provides access to the following product types:
- Baseline satellite of surface reflectance from both Landsat and Sentinel-2
- Land and products include fractional cover data, mangrove canopy data from 1987, as well as a wetlands insights tool for Queensland
- Inland products include water observation data, Australian water bodies, mean sea level data from 1988 and a range of tidal data products
- The products provide bushfire hotspots data
- Interactive tools and provide users with access to free tools such as the Sandbox, DEA Map, Hotspots Map, Explorer and reports.
The data are available via the DEA Datacube , the Content Management (CMI), Amazon Web Service (AWS) S3 and the Web Map (WMS).
The DEA Sandbox
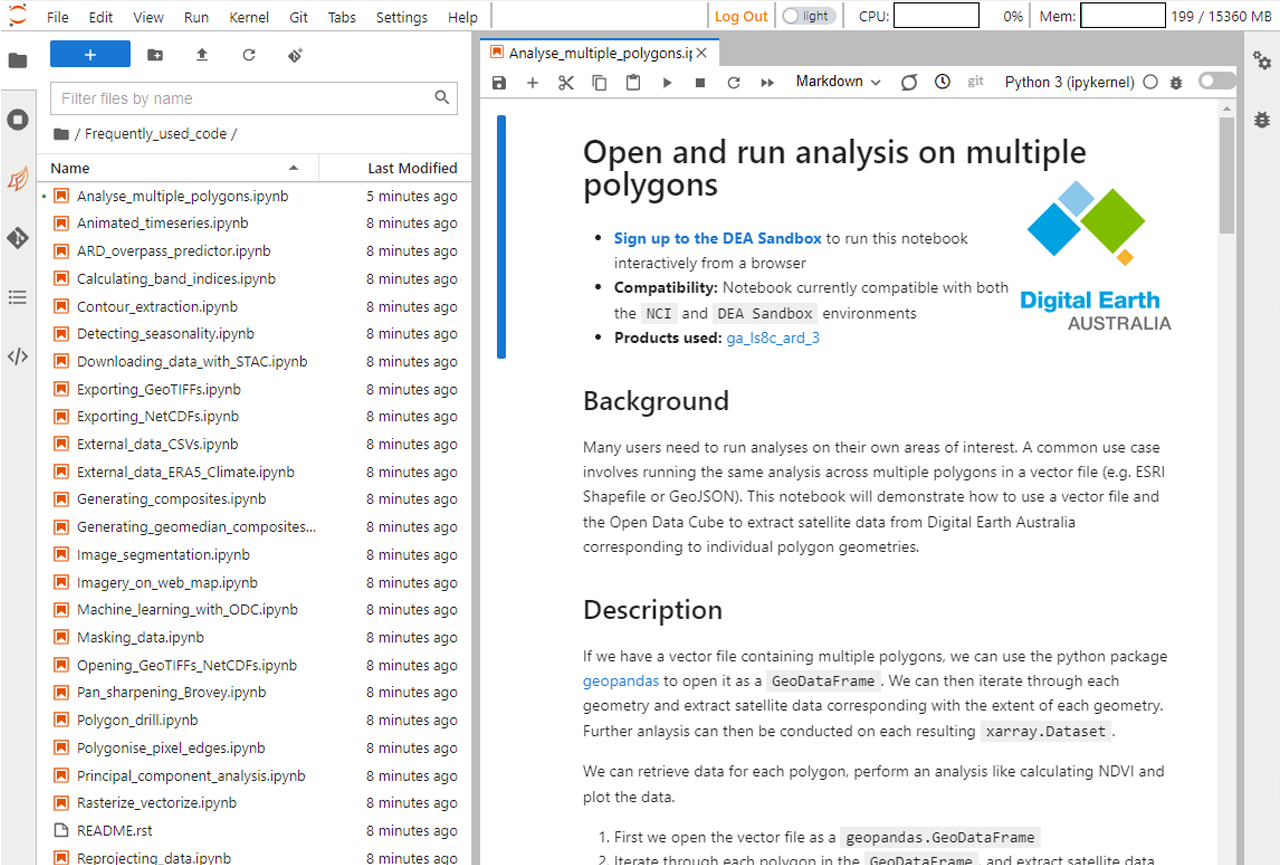
The is a free environment designed for users to learn about the Open Data Cube and analyse Digital Earth Australia data.
The web-based interactive development environment comes pre-loaded with DEA-specific Jupyter notebooks, including a beginner’s guide, DEA data, recipe book of code examples, and real-world examples of more complex case studies.
ODC is supported by an active community on and GIS Stack .
The DEA Map
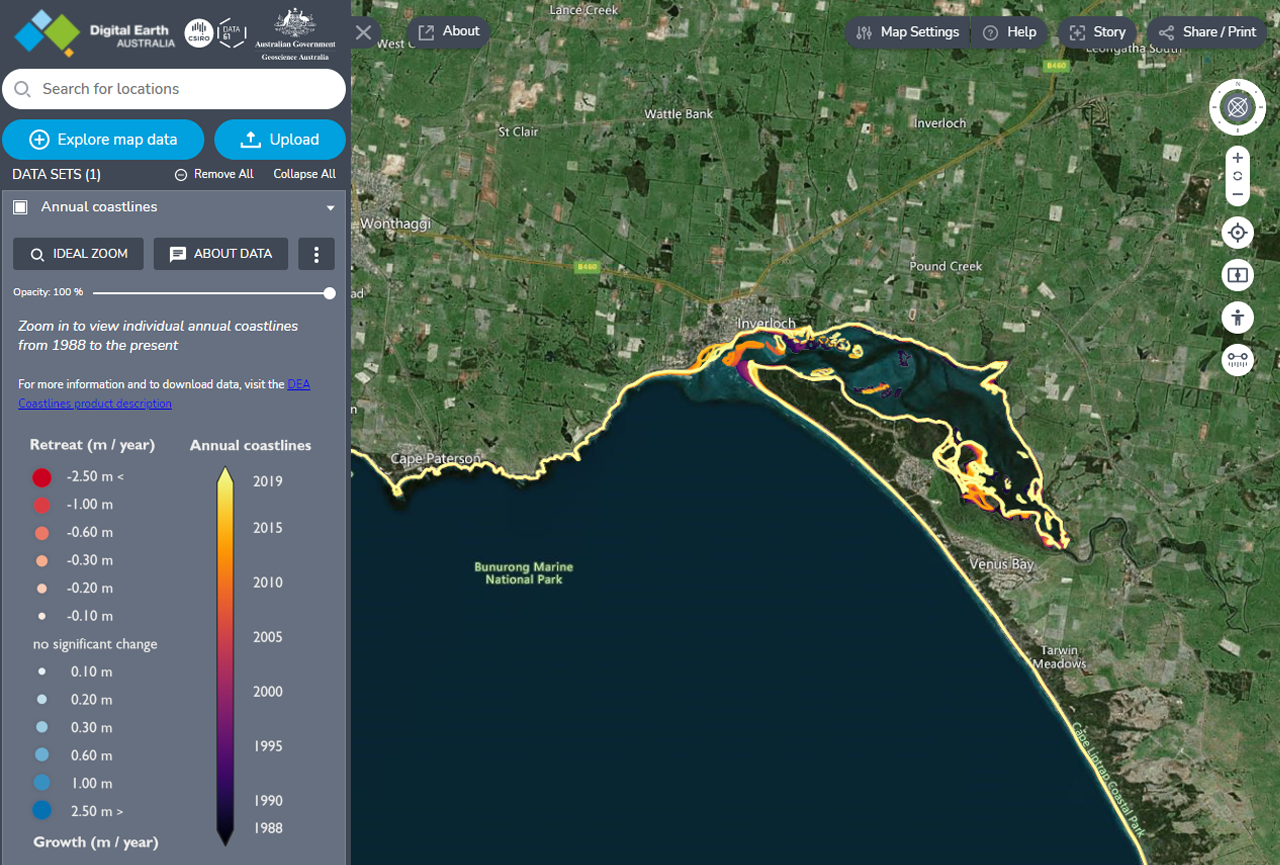
The is usually the first point of contact with Digital Earth Australia for most general users. Developed by , the map allows users to interact with DEA’s extensive satellite data products, as well as allowing users to upload data.
Users can add multiple data layers and view the data using predefined styles, such as simple , , , false , near and normalised burn .
The map settings allow users to select the base map type (eight options), map view style (3D terrain, 3D smooth or 2D) and also determine the balance between raster map quality versus performance.
The map also provides the ability to enter split-screen mode and compare different data layers and time periods, measure distances and view in street/pedestrian mode. Users can even create and share interactive stories from the map.
The second part of our post on Digital Earth Australia will dive deeper into the data and take a closer look at the Sandbox.
If you've worked with DEA data or any of the tools, we’d love to hear from you. Alternatively, if you have suggestions about what else we should cover — either related to Digital Earth Australia or another topic — please let us know. Get in touch via (@salsadigital), or through our .


