On this page:
Gambling in Australia
We don’t need to see a bunch of charts to know that gambling is big business. Australia was one of the first countries to deregulate gambling. There are new casinos set to open in Sydney and Brisbane, and it seems there are more and more online betting sites entering the market each sporting season. But just how big is the gambling industry in Australia?
The Queensland Government Statistician's (within Treasury) provides an annual report on gambling in Australia. The report, Australian Gambling , and other related data provided by the Department of Justice and Attorney-General on provide comprehensive statistics on legalised gambling in Australia.
In this Open Data Insight, we provide a snapshot of gambling in Australia, and also take a look at gaming machine numbers in Queensland.
A nation of punters
Australians' expenditure on gambling (i.e. actual out of pocket expenses for the punters representing the amount wagered minus the amount won) was $23.7 billion in 2016-17.
While this may not seem big compared to the USA or , Australians lead the when it comes to the amount gambled and lost per person. We lost a staggering $1,251 per adult in 2016-17.
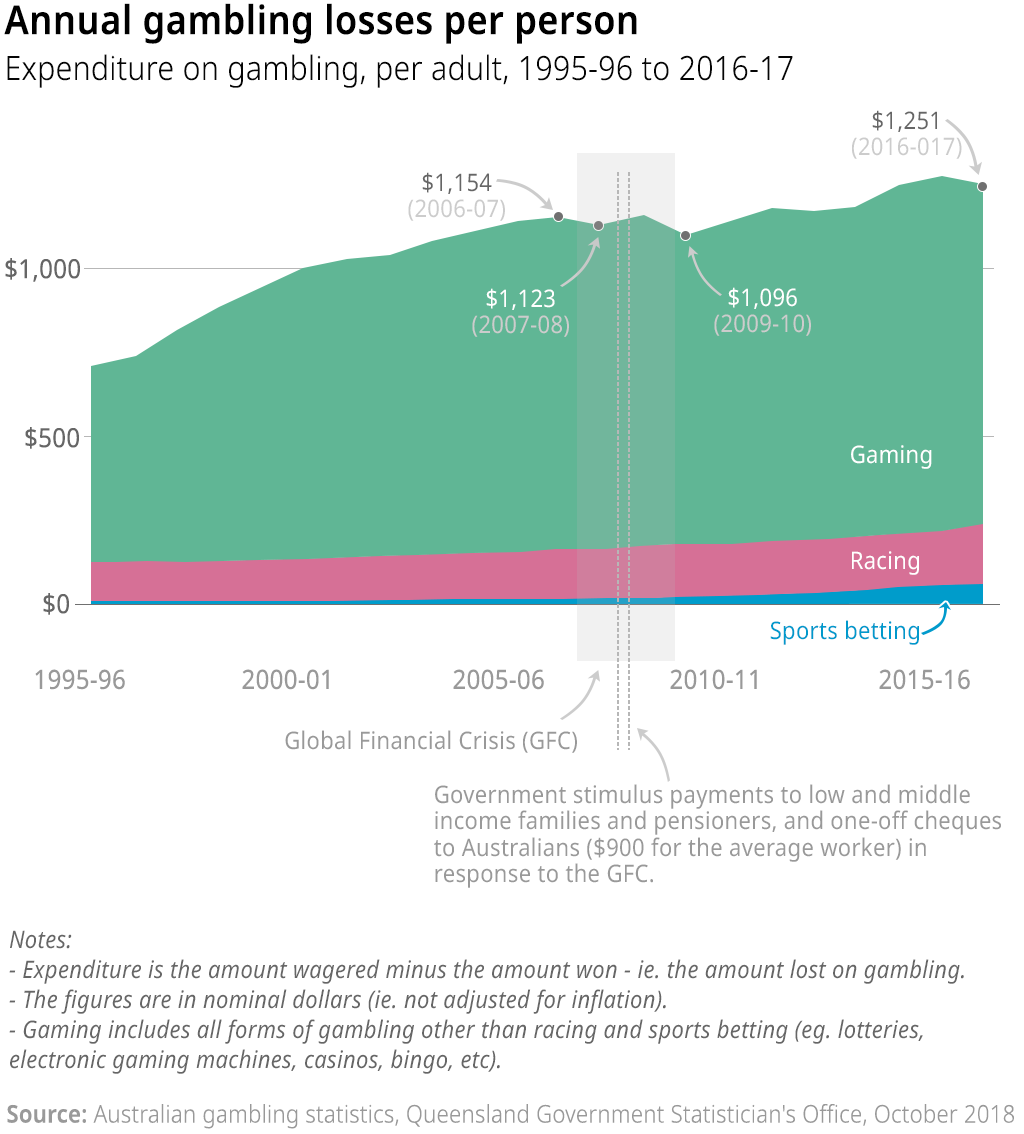
Australia’s expenditure on gambling per adult, 1995-96 to 2016-17 in nominal dollars (i.e. not adjusted for inflation).
Since 1994-95, our per capita expenditure has more than doubled — from about $616 in 1994-95 to $1,251 in 2016-17. Most of this comes from gaming (gaming machines, casinos and lotteries), but the amount of losses from sports betting has started to increase in the last few years.
Note the slight drop in per adult losses for the first time in 2006-07 (and it remained relatively flat until 2014-15). This slowdown roughly coincides with the global financial crisis, and the end of Australia’s mining boom, but further analysis is needed to determine whether these economic conditions played a role (including the impact of the government’s stimulus package), or whether there were other factors.
Let’s break this down by states and territories to see who the big spenders and losers are.
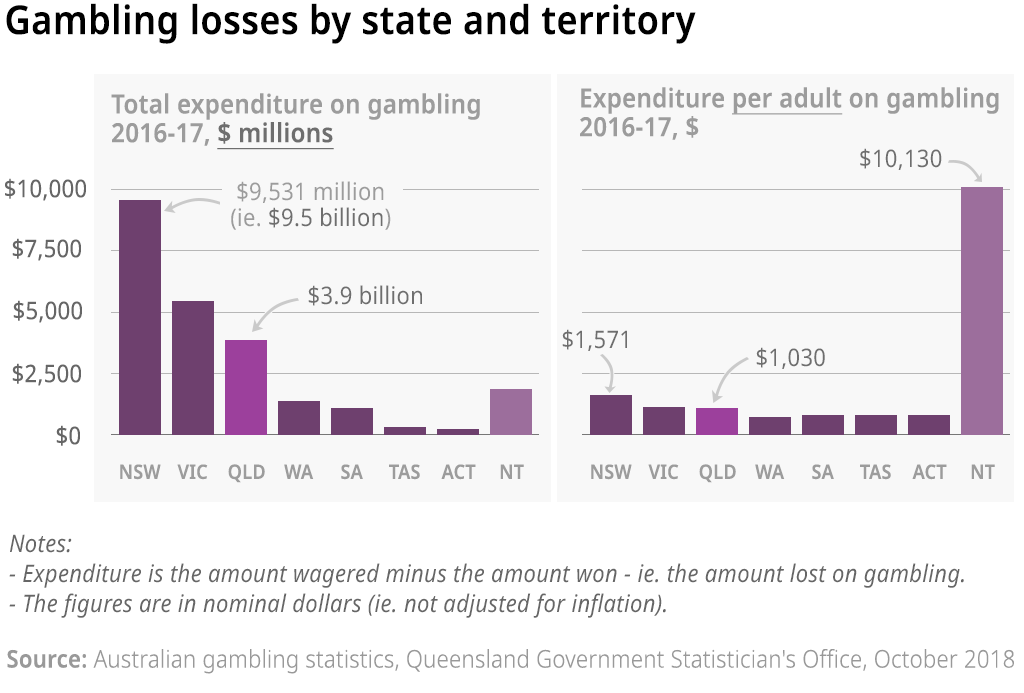
Total gambling expenditure and expenditure per capita for Australian states and territories, 2016-17 (nominal dollars).
Whoa! Northern Territorians are losing an unbelievable amount of money on gambling - more than $10,000 per adult.
Let’s see what type of gambling the Territorians are spending their hard-earned cash on.
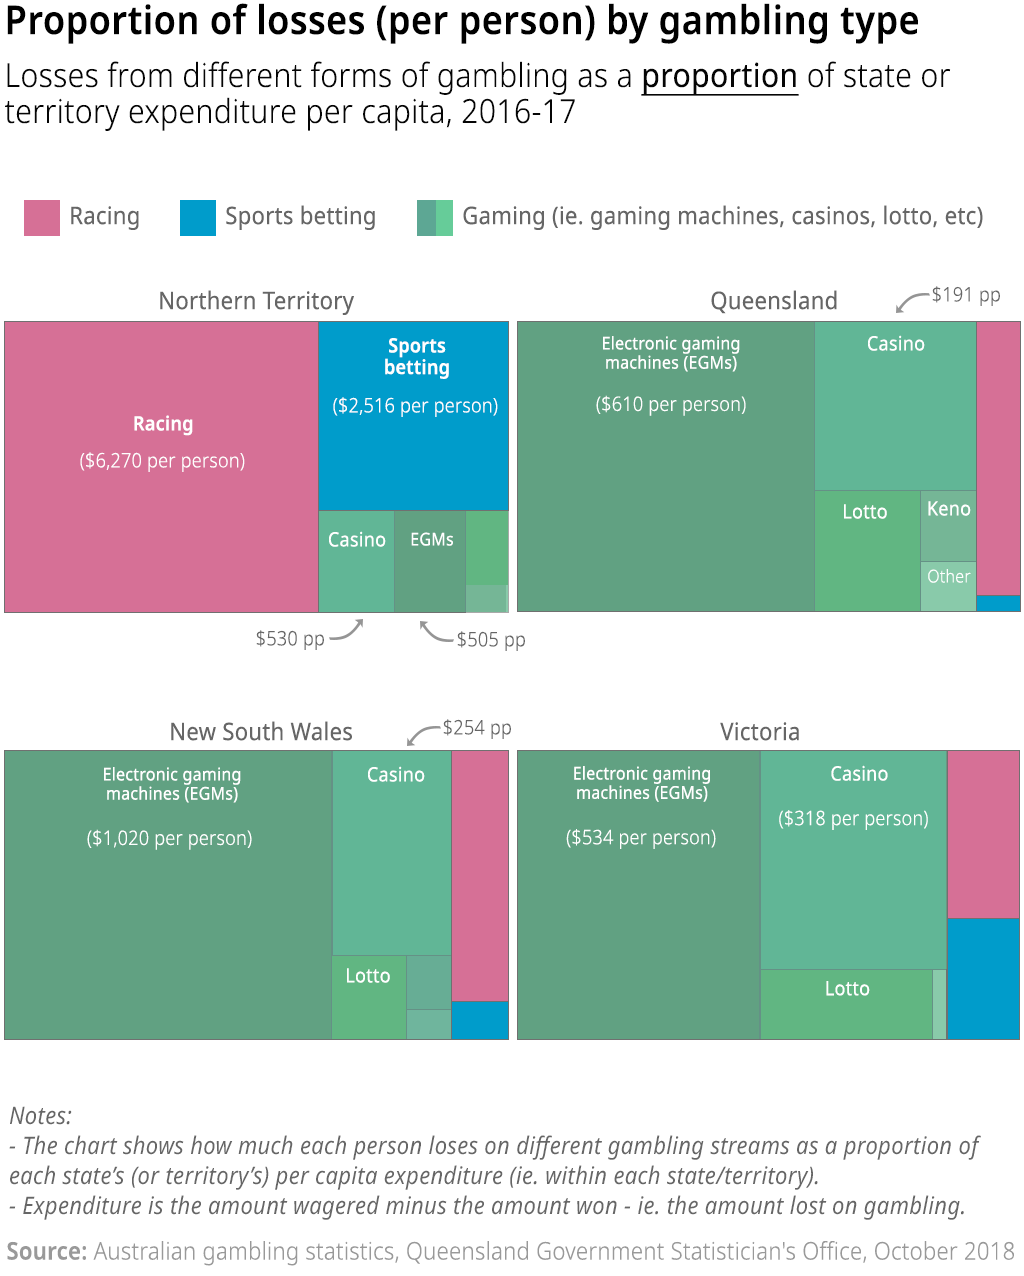
Losses per capita from different types of gambling as a proportion of state or territory expenditure on gambling, 2016-17.
The gambling profile for the Northern Territory is definitely different compared to the other big three states. Racing and sports betting dominate in the Territory, whereas gaming (and especially pokies) is the dominant form of gambling expenditure in other states.
What’s going on here?
Well, it turns out the Territory has fairly attractive taxation laws which have made it a haven for online sports betting and corporate bookmakers. So the high per capita losses are probably due to the many bookmakers and sports betting agencies registered in the , not Territorians going mad on punting.
The other story from the above charts is gaming machines (i.e. "pokies"). People lose a lot of money on the pokies. In NSW, the punters lost $1,020 per adult. And Queenslanders lost about $610 per adult. And these numbers are increasing.
We’ll look at Queensland pokies data more closely using the All Gambling Data , which contains monthly expenditure data for all gambling streams in Queensland from July 2004 to July 2019.
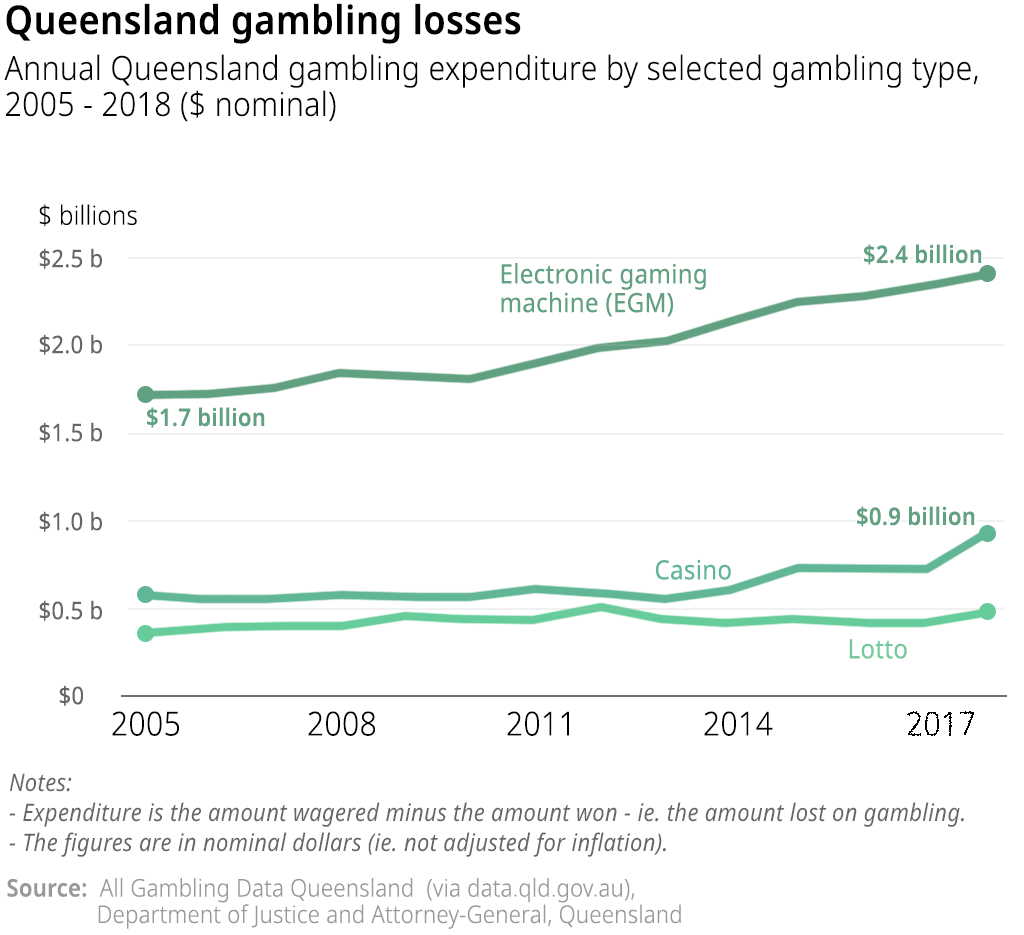
Annual gambling expenditure in Queensland by selected gambling stream, 2005 to 2018 (nominal dollars).
Not only is pokies the most costly for gamblers (by a long way), expenditure on pokies has grown significantly since about 2010.
Another thing to note is that gambling losses at Queensland casinos have increased sharply in the past few years also, as has lottery expenditure.
What happens if we look at monthly pokies losses -- can we see any patterns?
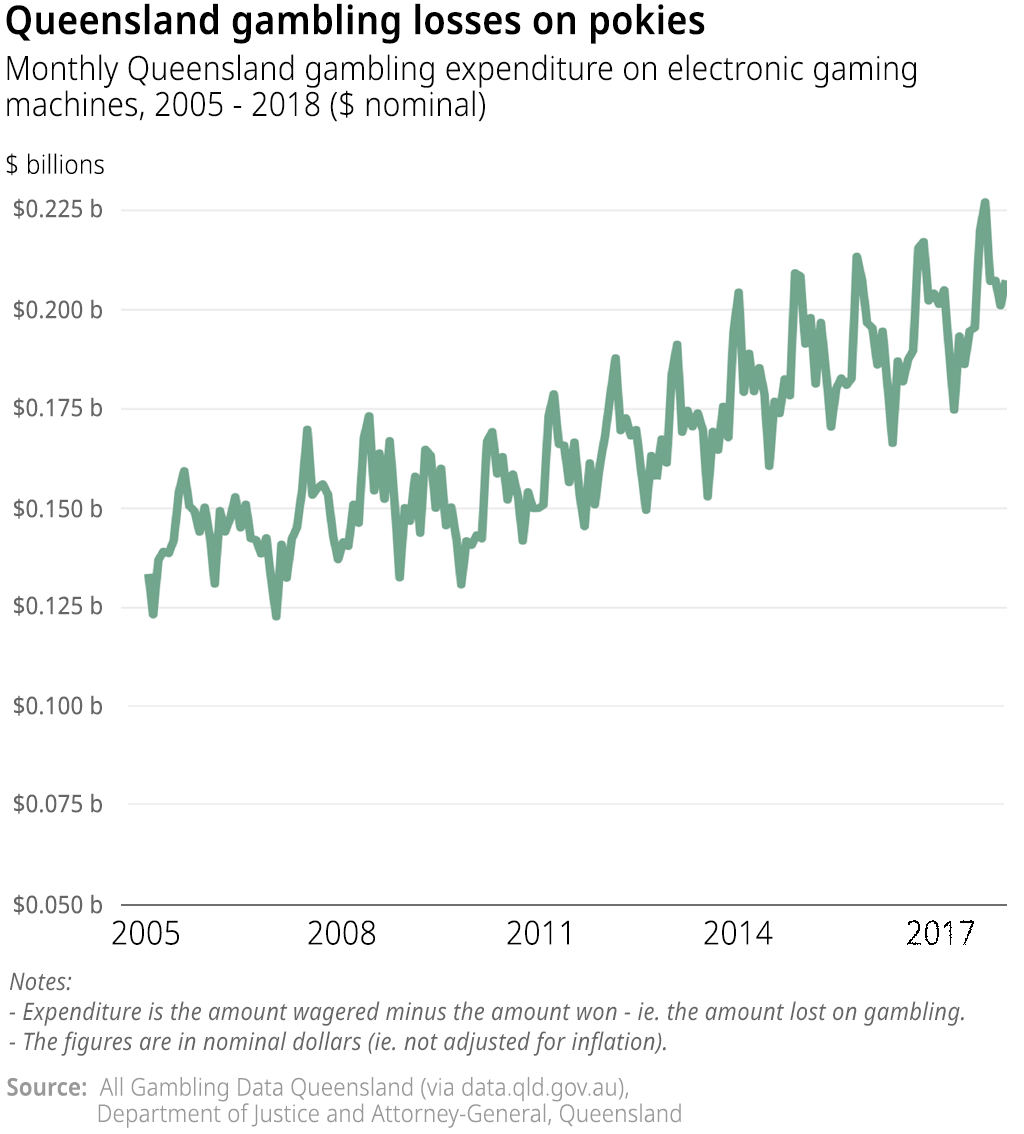
Total monthly player expenditure on pokies in Queensland, 2005 to 2018 (in nominal dollars).
Uhmm...interesting. There is clearly a cyclical pattern to electronic gaming losses. This might be clearer if we look at the data as a heat map (we will only look at pokies, but there are interesting patterns in the other streams too that are worth a look).
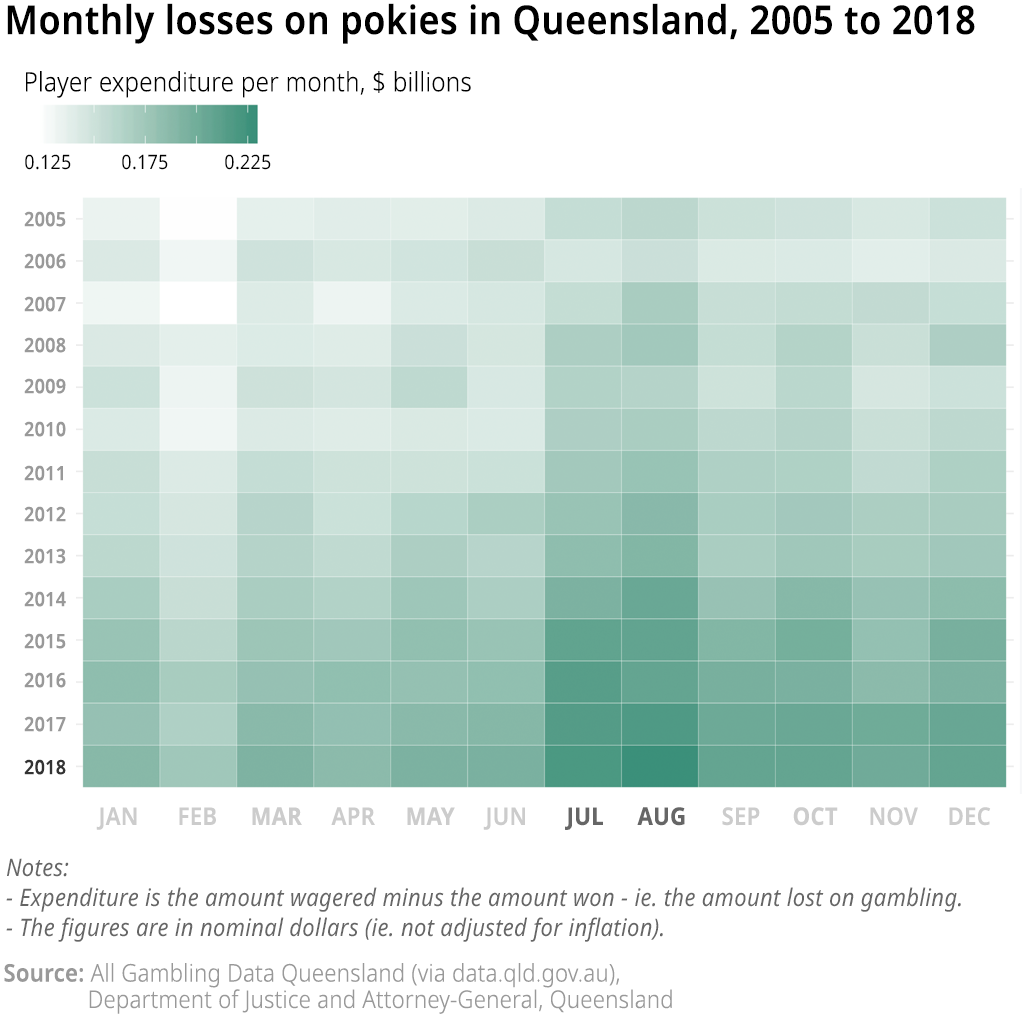
Monthly player gambling expenditure on electronic gaming machines (ie. pokies) in Queensland, 2005 to 2018 (nominal dollars).
July and August consistently seem to be the two months where players lose more money. Could this be related to tourists from southern states coming to Queensland for winter? More investigation is needed, which we’re going to leave to you.
According to Total Queensland Gaming Machine , which contains monthly gaming machine data for all clubs and hotels from July 2004 to July 2019, there were 1,109 sites with gaming mashines in Queensland, and 41,699 operational gaming machines.
And at least $222,659,461 was lost by gamblers on pokies in July 2019. That's about $5,400 per machine in that month. Remember — one month, one machine!
If the average loss on a machinee is about $5,400 in a month, in what areas are people losing more than the average?
Queensland local government areas with the most number of operational gaming machines, July 2019.
At least $222,659,461 was lost by gamblers on pokies in July, 2019. That’s about $5,400 per machine in that month. Remember -- one month, one machine!
If the average loss on a machine is about $5,400 in a month, in what areas are people losing more than the average?
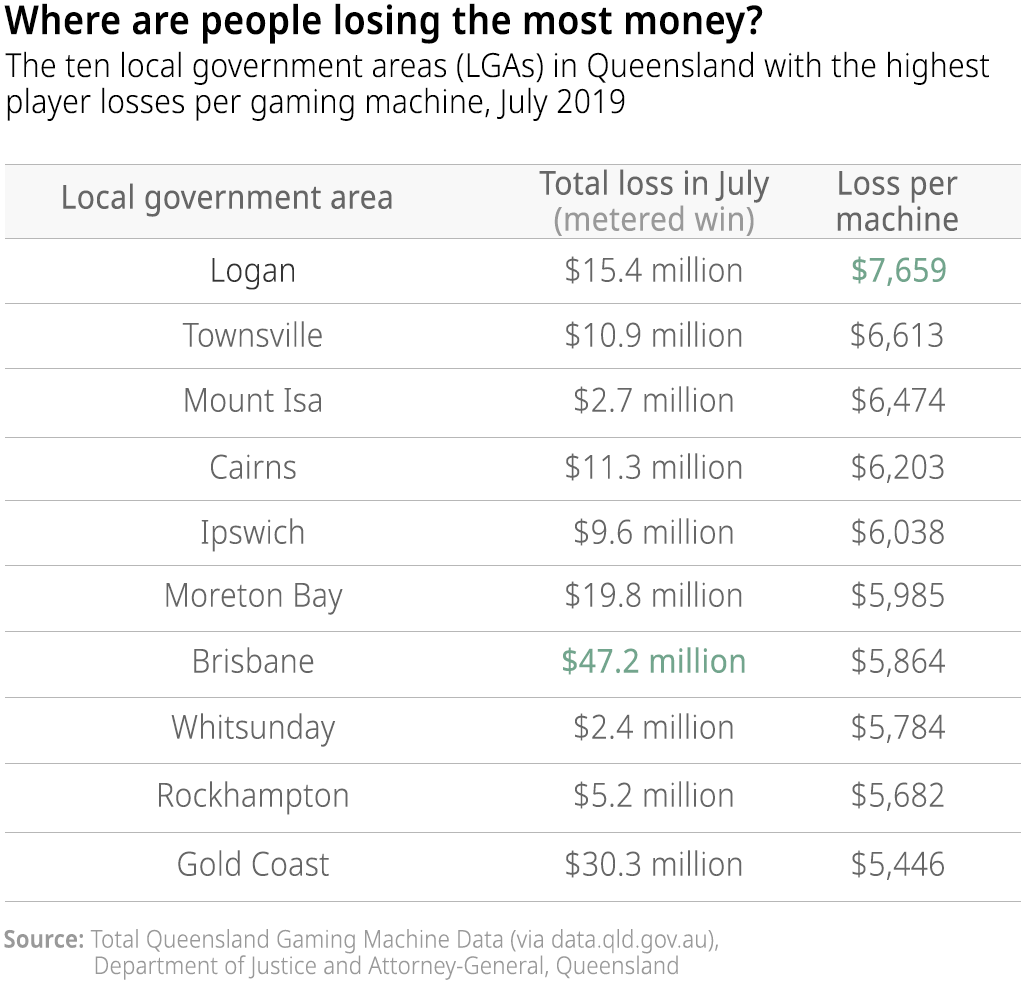
Queensland local government areas with the highest player expenditure per gaming machine, July 2019.
Look at the player losses per machhine in Logan: $7,659 per month, more than $2,000 above the average. But a word of caution — the above does not take into consideration the relative population in the regions, only the loss per machine. Again, we hope that you will be able to do more analysis and look at regional gambling data in more detail.
If you do explore this data further, we’d love to hear from you!
The Australian Gambling Statistics report (and associated data) is from the Queensland Government Statistician's Office (Queensland Treasury).
Website:
Twitter: @qldtreasury
LinkedIn:
Queensland gambling data isfrom the Department of Justice and Attorney-General (Queensland Government).
Website:
Twitter: @justiceQLD
LinkedIn:
Data via:
See any errors or issues? Please let us know.


