
The Statewide Landcover and Trees Study
In suburban areas, it is relatively easy to know if our neighbours have cut down a tree. But to monitor land clearing across a state as large as Queensland, the Queensland Government’s Department of Environment and use SLATS – the Statewide Landcover and Trees , which will be the focus of this month’s Open Data Insight.
SLATS is an incredible and important dataset. The main purpose of SLATS is to detect human clearing of trees and shrubs to help the regulation of the Vegetation Management Act . But the study’s range of spatial data and reports are used for many other land management purposes. For example, SLATS-derived data is used to help manage the Great Barrier Reef, provide input to State of reports and inform biodiversity conservation and planning policies.
Watching from 700km above the Earth
Producing the SLATS data and report is a long and complex , and it’s important to provide some background so we know what we’re looking at before going into the analysis.
SLATS uses about 99 satellite scenes to produce the data, which are taken in the dry season to maximise the chance of cloud-free days and to minimise the green flush of the ground layer, optimising woody vegetation detection. Ideally, a given region is mapped using a single satellite scene exactly one year apart. But if that day is cloudy, the nearest cloud-free scene or a composite of several images is used and the data is analysed to account for these slight differences in the length of the analysis period each year. This is one of the reasons why the data is expressed as a clearing rate (hectares per year) from 1 August to 1 August, and not as a total area of land cleared.
The initial analysis is done via a sophisticated land cover change detection algorithm and then manually reviewed and edited by trained staff. The summary data is published to .
Regulating land clearing in Queensland
Let’s take a quick look at the overall clearing rates for Queensland. The chart below shows the clearing rates from 1997-99 (note the two-year period) to 2017-18, grouped by and non-remnant vegetation.
Woody vegetation clearing rates (ha/year) in Queensland, 1997-99 to 2017-18
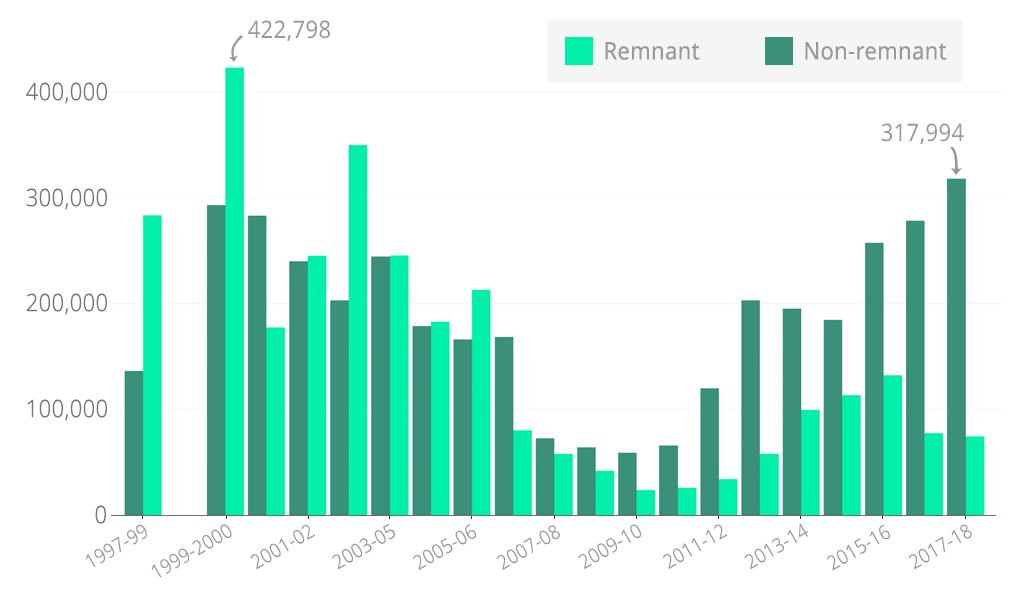
While this is a relatively small sample of data, spanning about 20 years, it shows considerable variation. The clearing rate of remnant woody vegetation in Queensland decreased from about 423,000 hectares per year in 1999-2000 to a low of 24,000 hectares per year in 2009-10. It has since shown a general increase, and was about 74,000 hectares per year in 2017-18. A similar pattern exists for non-remnant vegetation, which was about 318,000 hectares per year in 2017-18.
So what happened? One possible reason has to do with land clearing laws. Firstly, the Vegetation Management Act came into effect in the latter part of 2000. The Climate Council of Australia the big spike in clearing in 1999-2000 to people wanting to clear before the Act came into effect (a similar spike happened in in 2016-17 before the introduction of new laws, but the numbers in Queensland are much larger).
The laws were progressively strengthened to protect native vegetation, leading up to the government announcing that they would bring an end to broadscale clearing in 2006.
Vegetation management laws and their impact on Queensland’s land clearing rates, 1997-99 to 2017-18
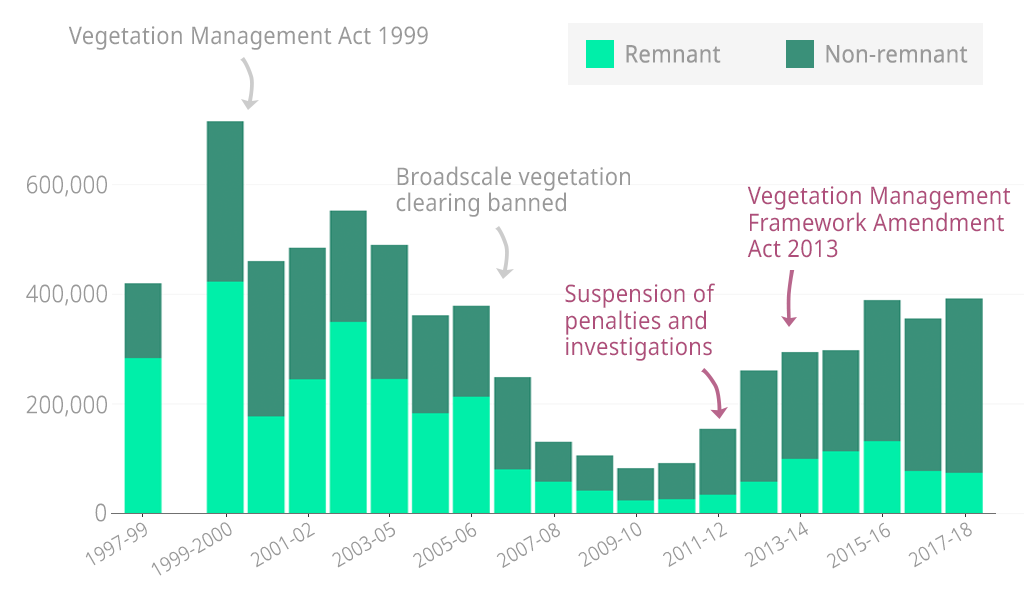
In 2012, the elected Campbell Newman government came into power and vowed to repeal a number of these vegetation protections, policies that regulated vegetation clearing, and placed all investigations and prosecutions on hold. Then in 2013, the government enacted the Vegetation Management Framework Amendment , which further weakened protections of the original Act.
Then, in early 2018, with the return of the Palaszczuk Government, to the vegetation clearing laws were enacted that provided greater protection for remnant and non-remnant vegetation, including riparian vegetation in the Reef catchments.
What happens to the cleared land?
While the SLATS data does not provide detailed analysis of land use and land use change, it does provide an indication of what the cleared land is changed to. This happens during the manual editing stage, an indication of the replacement cover is based on a combination of visual inspection and ancillary data.
In 2017-18 a significant majority of the cleared vegetation had been replaced by pasture. And a quick look at past data shows most cleared vegetation has been replaced by pasture in Queensland.
Woody vegetation clearing rate and the purpose of land clearing, 2017-18
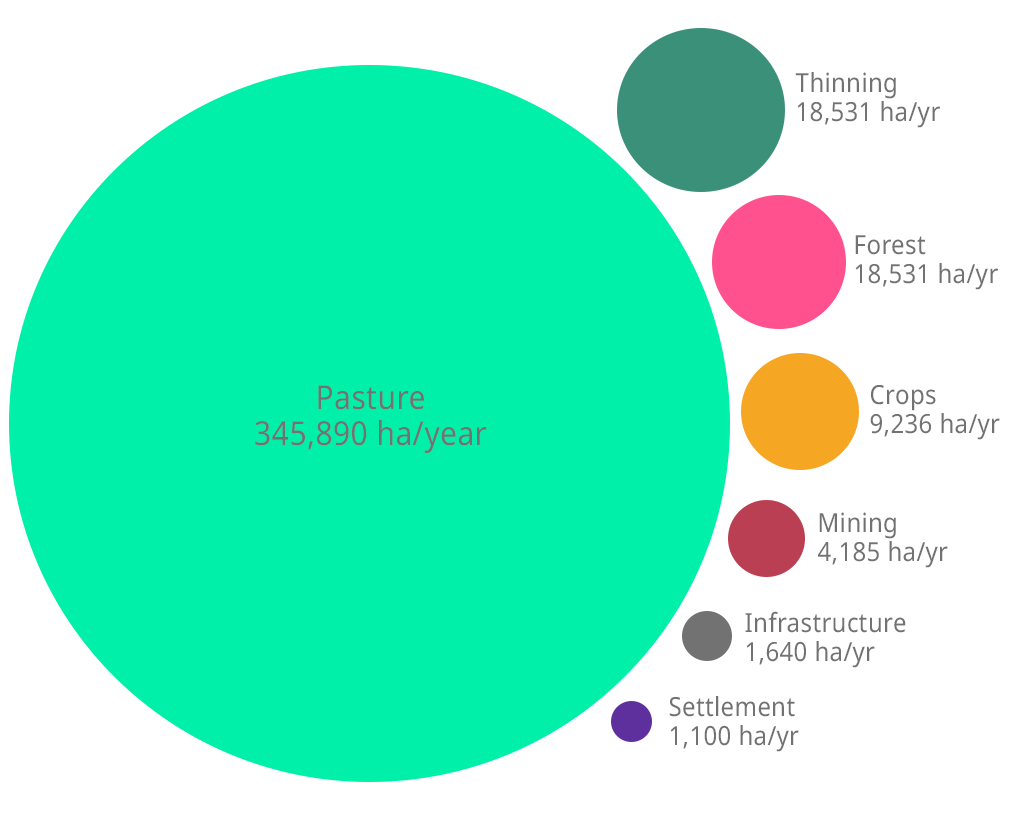
Queensland has significantly more beef than other states, and an estimated 129 million of land in Queensland was used for grazing in 2016-17 – the most of any state or territory.
If we remove pasture from the data momentarily, we can focus on what else is happening.
Clearing rate by replacement class trend, 1988-91 to 2017-18
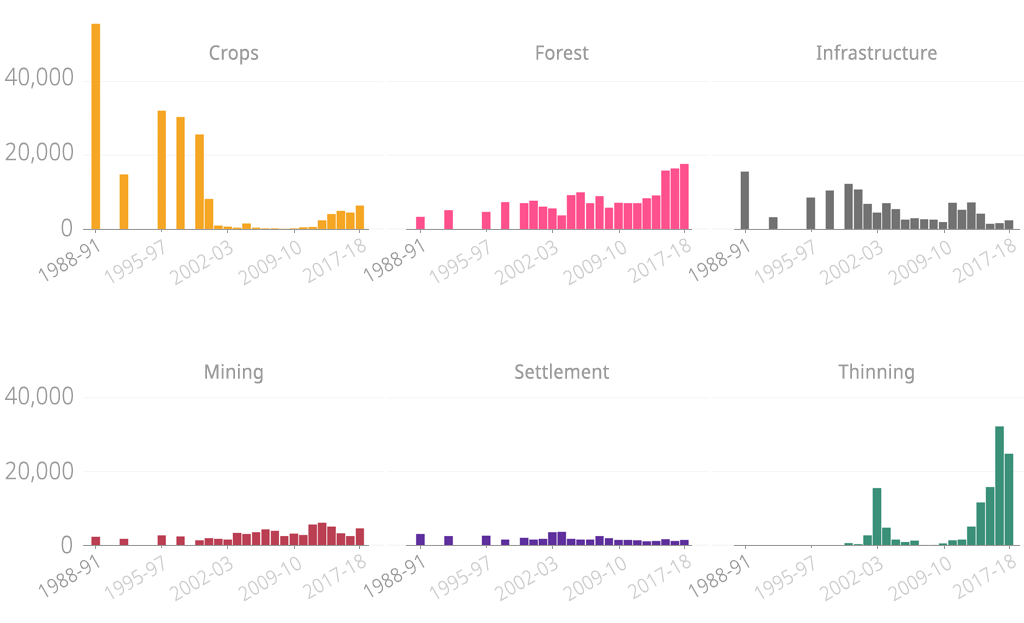
This shows that large areas of land were initially cleared for crops during the early years of SLATS and leading up to the new laws. Clearing for crops has shown a recent increase. There has also been a recent increase in the clearing of woody vegetation for the purposes of thinning and forestry.
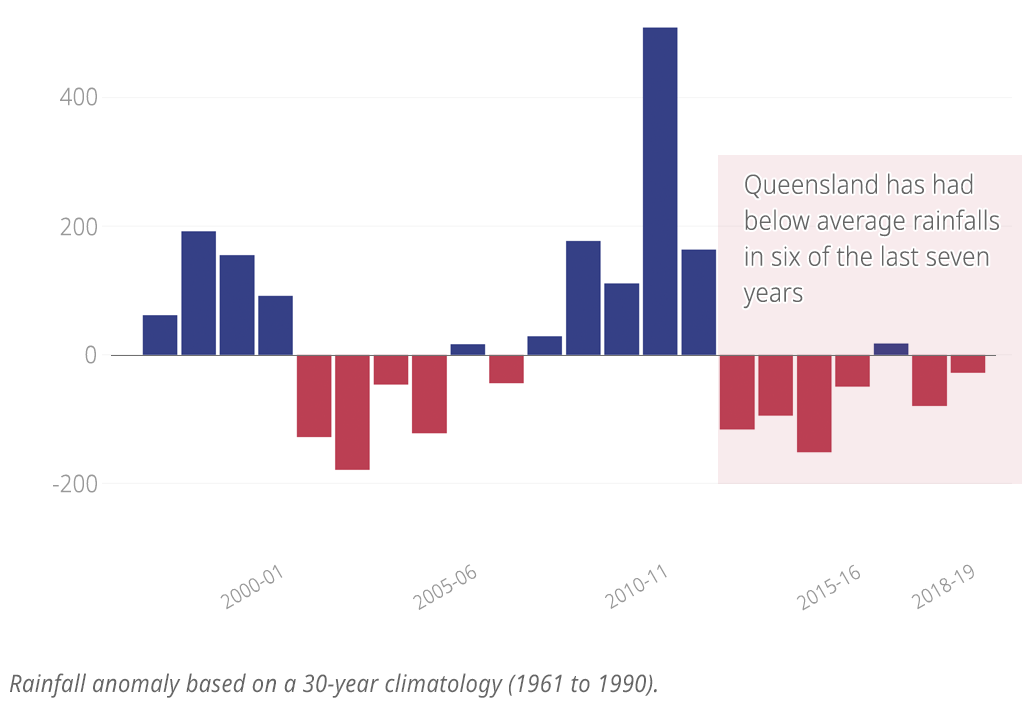
The rise in thinning could be partly due to farmers using shrubs as fodder for sheep and cattle – a common practice in periods of drought. As we can see from the rainfall anomaly chart below, Queensland has had below average rainfall for the past few years. In December 2019, the government about 67% of the state officially in drought.
Where is the land clearing occurring?
The SLATS data breaks down the clearing rates into several geographic classes, such as , drainage , catchment , and local government areas.
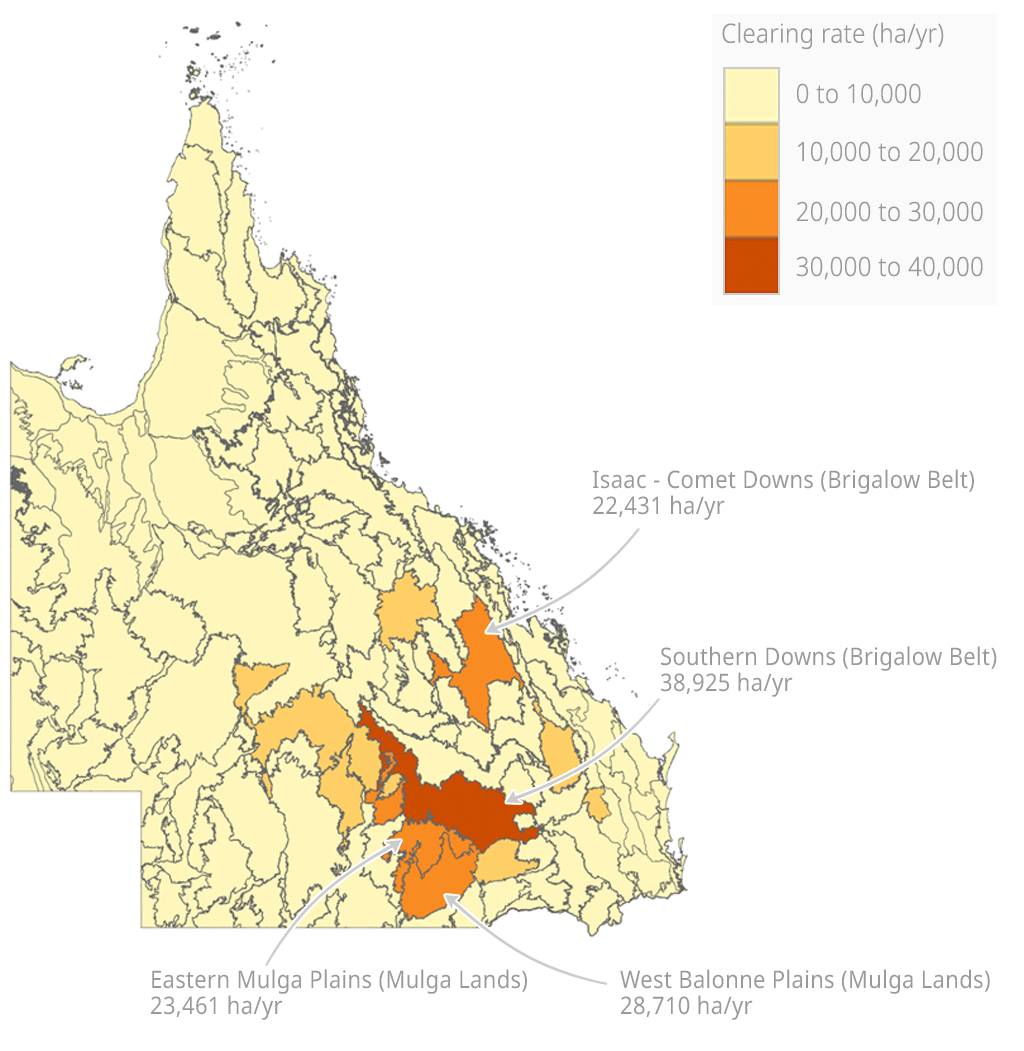
The data shows that most of the clearing has happened in the Brigalow Belt bioregion and – to a lesser extent – the Mulga Lands. As expected, a significant proportion of the clearing was for pasture as these regions are primarily used for grazing. The map below shows the intensity of clearing mapped at sub-bioregion for more specificity.
Clearing rate (ha/year) by sub-bioregions, 2017-18
Let’s again take pasture out of the equation, and see the different reasons for clearing in the various bioregions.
Clearing and replacing woody vegetation in bioregions
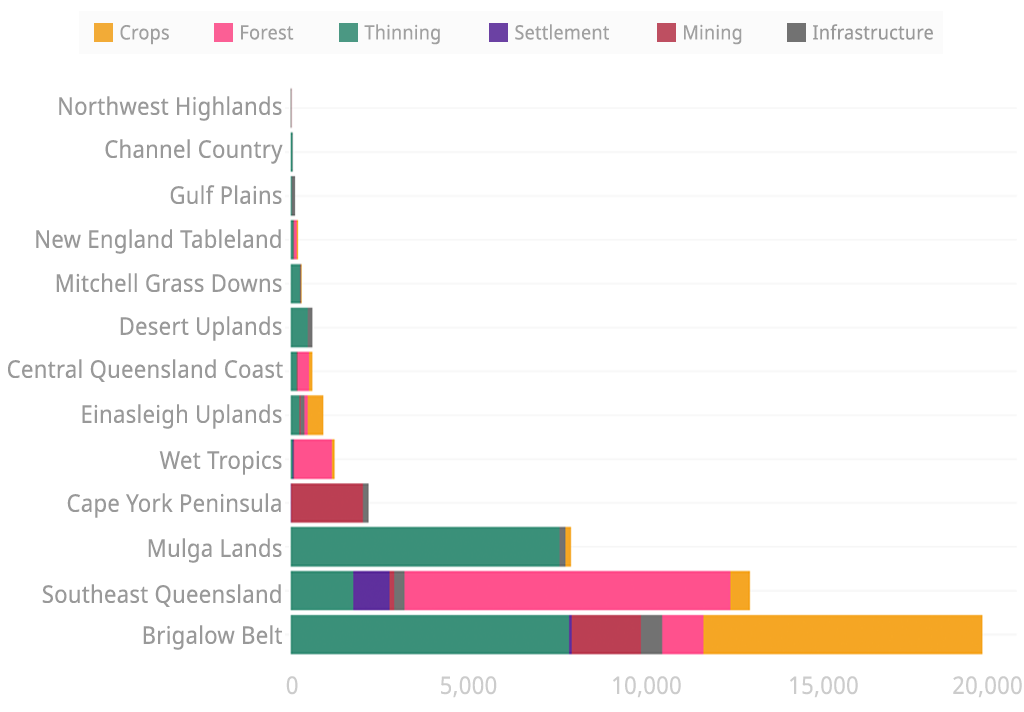
Excluding pasture, the clearing is mainly for crops and thinning in the Brigalow Belt, but there was also noticeable land clearing for mining, forestry and infrastructure. Cape York Peninsula saw the most mining-related clearing and Southeast Queensland had the highest rate of land cleared for forestry and settlements.
The SLATS data is all publicly available, summarised by a range of spatial regions as well as whole of state. Its consistency of method and approach means temporal and spatial trends can be assessed with confidence. As always, if you do any analysis or visualisation with this dataset, we’d love to hear from you.
The Statewide Landcover and Trees Study (SLATS) is provided by the Queensland Department of Environment and Science via .