On this page:

What is storyboarding?
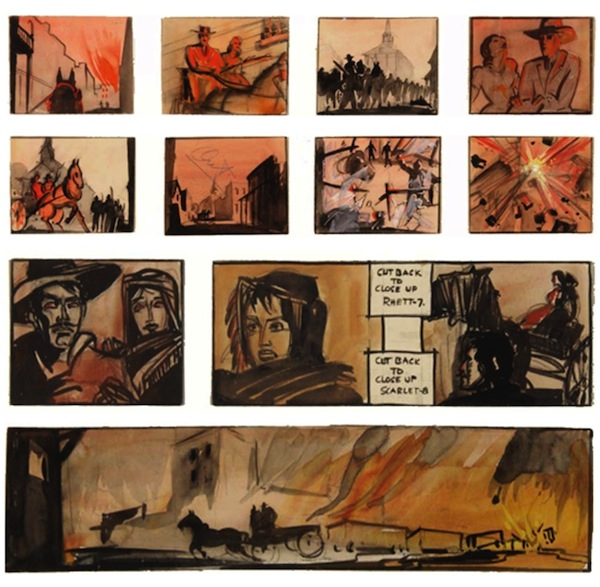
The concept of storyboarding is most commonly associated with the movies. A series of boxes with accompanying notes are used to plan scene and camera concepts. It allows storytellers to visually show key shots.
Gone with the Wind Storyboard by William Cameron Menzies
Source:
Storyboarding for websites
Like movies, website interfaces are a very visual medium, and it can be hard to describe requirements with just words.
At its core, storyboarding is just drawing boxes on designs, and scribbling down key points. Chances are, if you have an office pinboard with user stories / UX / UI printouts attached, or a meeting room with a whiteboard with roughly sketched boxes and text, then you already do this. The problem is that these real-world sketches and layouts don't transfer nicely into a digital realm. We take a photo of a whiteboard after a meeting and upload the JPEG, or we admire the pin-board for a day, then quickly find it out of date after the first sprint (and only visible to people in the office).
It's a shame, because these sketches are so useful to get a point across, but are often translated into a series of bullet points and added to a JIRA ticket, never to be looked at again.
A storyboard should be a continually updating digital whiteboard, with diagrams, designs, annotations, concerns, and anything else. A quick-glance overview to supplement ticket acceptance criteria.
What should a storyboard say?
What a storyboard includes will change depending on the information you're trying to convey. Below are some real-world examples of storyboards.
Migration of old theme to new theme
For our migration of Stay Smart Online onto the GovCMS platform, we used a storyboard to map the existing components of their current website onto like-components in GovCMS with an aim for minimal modifications to the default UI-Kit theme. The storyboard helped to identify how data would be migrated across — what features were available, and what needed custom work.

A first draft to map the migration of content from an existing site to the GovCMS platform. Red arrows point from the existing site's components to the components they best match on GovCMS. Green circles represent new components.

A second pass at the same feature mapping. Shows existing site to the left, the GovCMS default theme in the centre with arrows on red components to their GovCMS equivalent. Green boxes represent new components. The right side boxes gives names to these components.
This is a one-to-one comparison, but storyboards can be adjusted to highlight components across multiple sites and how they map onto a single, common theme. This could be used to compare the differences between sites and identify all the gaps.
Components of a system
This storyboard was used to break down design components into reusable chunks so they could be applied to different content management systems. This storyboard provides some additional technical detail about the sub-component style naming and nesting. You can also see a coloured letter next to each description box — this was used to illustrate which components were assigned to which developers. This storyboard was used in the initial prototype development stages, where it was quicker than capturing this information in a formal ticket process.

Designs with SASS naming definitions in white boxes, developer assignments to the top right of each white box and ticket. Bottom right of white box shows a tick for complete items, a ticket name and number. Red boxes illustrate rough backend and frontend development notes and questions.
Split of components to tickets
This storyboard was a quick ticket reference for components. As components get broken up over sprints, keeping track of where tickets are for which components can be simplified with a visual outline like below.

Showing components with their ticket name, number and link.
What tools can I use?
The above examples were produced using Google Drawings. Google Drawings was chosen for a few reasons:
- It's easily shared among staff and clients.
- It's always up to date.
- It allows for feedback and collaboration.
Storyboards is an idea more than a technology, so while Google Drawings may be what we’re using today, there are limitations.
Other alternatives like provide the above features, with the addition of:
- Higher resolution output
- More creative control
- Shared components
- Integration with real designs through team libraries
Storyboards could easily work with Microsoft OneNote as well; and pairing with the touch screen and stylus support on the Microsoft Surface product line would allow for faster mockups.
Salsa's take
At Salsa we're still finding our feet with storyboards. It's a nice idea, but with only a few small case studies to go by, we haven't begun to realise all the ways shared storyboards could improve our internal processes. Hopefully, the follow up storyboard Salsa blog headline will read "Productivity increased 1000%!" but until then we'll continue experimenting with storyboards to refine the workflow and improve our process.